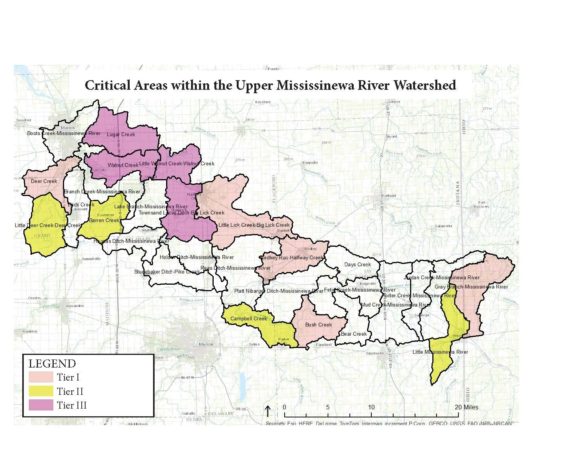
Critical Areas
Water quality data was used to identify critical areas and geographic analysis was used to identify which best management practices (BMPs) might be most effective at reducing nonpoint source pollution in these areas. Public input was also considered.
FIG 1 | Water quality results and water quality concerns were used in the selection of critical areas. The map above shows Tier I, II, and III critical areas.
| County | Acres in Watershed | Percentage |
|---|---|---|
| Grant | 128,200 | 30% |
| Blackford | 48,000 | 11% |
| Delaware | 78,000 | 18% |
| Randolph | 115,000 | 27% |
| Jay | 37,500 | 9% |
| Darke | 20,000 | 5% |
Critical Areas
TABLE 1 | Tier I, II, and III Critical Areas Listed by County and Impairment
| Impairment | Grant | Blackford | Delaware | Jay | Randolph | Darke |
|---|---|---|---|---|---|---|
| Nutrients | Deer Creek, Little Deer Creek, Barren Creek, Lugar Creek, Little Walnut Creek | Little Walnut Creek, Little Lick Creek | Halfway Creek | Halfway Creek | Little Mississinewa, Gray Branch | Little Mississinewa, Gray Branch |
| E. coli | Lugar Creek, Barren Creek | Little Lick Creek, Big Lick Creek | Little Mississinewa | Little Mississinewa | ||
| Sediment | Walnut Creek | Little Walnut Creek | Campbell Creek | Little Mississinewa, Gray Branch, Campbell | Little Mississinewa, Gray Branch |
Priority Sources
Land use data and water quality data were analyzed to identify sources of non point pollution throughout the watershed. This data was also used to prioritize each source. For example, data indicated that in subwatersheds with the highest TSS levels, the main source of the TSS was stream banks, as indicated in the table to the right.
TABLE 2 | Priority sources for nonpoint impairment reduction
| Impairment | Agricultural | Stream Banks | Urban |
|---|---|---|---|
| Sediment | Moderate | Highest Priority | Moderate |
| Nutrients | Highest Priority | Moderate | Moderate |
| Pathogens | Highest Priority | Low | High |

