
Geographical Analysis
The Upper Mississinewa River watershed is all the land that drains toward the Mississinewa River. As water travels to the streams and rivers, through overland flow or groundwater flow, it collects and carries pollutants like sediment and nutrients to streams and rivers. This is called nonpoint source pollution because it doesn’t come from one point. In order to learn where pollutants in the Mississinewa River may be coming from, we looked at (a) current and historic land uses, (b) geology and geomorphology, and (c) stream management practices within the watershed. This information was used to suggest where to use different types of BMPs within the watershed (see Priority Areas).
Land use data came from six primary sources. Some of this data was existing and was accessed through publicly available databases. Other data was generated by the project manager, either from a windshield survey or GIS desktop survey.
1. Inventory of Previous Land Use Planning Reports
There have been five water quality and comprehensive planning reports developed in this region since 2001. The land use and geographical assessments included in the existing plans provided an effective starting point for development of relevant information to be included in this WMP. The plans have helped guide the Project Manager and aided in the understanding of many geographical features and land use concerns. There are many additional ongoing comprehensive planning efforts within the watershed (not necessarily water quality related) which are also briefly summarized. Summaries of additional reports and studies conducted in the watershed is included in Appendix G (A27).
2. Publicly Available Geospatial Data
Supplemental land use observations and resources (i.e. cartography, diagrams, tables, figures, and symbols) were generated through an analysis of land use data in ArcMAP by the Project Manager. Data sources were obtained predominantly from Indianamap.org, the NRCS Geospatial Gateway, the USGS, and the Indiana Spatial Data Portal. Basemaps were also obtained from data sources native to ESRI Infrastructure. Land use data tables were analyzed in both ArcMap and Excel in conjunction with IDEM land use modeling equations and formulas. References for other data obtained and discussed are included in the narrative or with tables (in the document or in appendices) and are referenced comprehensively in the bibliography found at the end of this report.
3. Desktop Aerial Assessment of Landuse Features
The Project Manager performed a visual assessment of the watershed (using aerial imagery) and identified features (relevant to the watershed management planning process) that had not been previously documented through public resources available at Indianamap.org. The Project Manager used the virtual globe software Google Earth, which displays the most recent aerial imagery available for the study. The aerial imagery used for the assessment was predominantly from 2012-2014 depending on its location in the watershed. Features included, but are not limited to: quarry sites, greyfields, rill/gully formation, urban junk storage sites, stream erosion, livestock access sites, and auto tracks. Observations are reported in the inventory and incorporated in the conclusions when relevant. Additional heat map diagrams and subwatershed based high-low gradient diagrams are located in Appendix E. The dataset generated for this assessment process is available upon request. Results and conclusions of the desktop survey can be found in Section 3.8.
4. Aerial Assessment of National Land Cover Database (NHD) Mapped Streams
The Project Manager performed a desktop survey of major NHD mapped streams. The primary objective of the analysis was to assess the presence of vegetation on stream banks and/or the presence of substantial buffering from the adjacent land use.
5. Windshield Survey
A windshield survey was completed as a supplement to the aerial assessment of land use features. The Project Manager collected water quality data from 2014-2015 and made ongoing observations of the landscape while driving to stream sampling locations. Formal documentation of sites was conducted from 2015 to 2016 by the Project Manager. Critical subwatersheds were targeted on the windshield survey completed on April 20 and April 29, 2016, with the exception of those subwatersheds that were critical for nitrate only. The Project Manager was confident, based on water quality and land use analysis, that cropland is the source of high nitrate levels in these subwatersheds; further investigation did not seem warranted. Results and discussion of the windshield survey can be found in Section 3.9.
6. Logjam Assessment and Inventory
The Project Manager canoed portions of the Mississinewa River in Randolph, Delaware, and Grant counties. These sections of the river were reported by landowners to have an exceptional amount of debris and/or morphological concerns. The assessments identified seven Condition 3 and three Condition 4 logjams located in Randolph County. A comprehensive report on these logjams, their history, and their potential sources in Randolph County is included in Section 3.7.
Geography
Our goal in exploring the watershed’s geography was to understand some of the geographical factors contributing to water quality. This information helps us better understand our public input and water quality data and helps us interpret trends in the watershed going forward.
First, we looked at the historical geography of the region. Over 10,000 years ago the glaciers created relatively flat till plains as well as the more sloping moraine regions. These regions are more prone to erosion. While forest wetlands were once prevalent due to the slowly draining soils in the region, the arrival and settlement of Europeans in the area resulted in land transformation and hydromodifications. Forests and forest wetlands were logged, and thousands of miles of underground field tiles were installed, carrying water to drainage ditches and streams. These watercourses were straightened, deepened, and widened, in order to drain water off the land more quickly. Land use in the region was mostly agricultural until the gas boom of the late 1800s, which brought factories to the area. Urbanization also occurred in the region, with the advent of railroads and road systems. In the mid-1900s, industrial agriculture resulted in a loss of small family farms. Various factors, including the loss of jobs and societal changes led to urban sprawl and population change.
Next, we looked at current trends and current sources of water quality problems. The population of the region is approximately 91,000. That being said, there are many people making day to day decisions that can negatively impact water quality. Some of the greatest causes are urban areas where pollutants enter waterways through stormwater infrastructure and waste management systems, rural areas where septic are not properly maintained, and agricultural areas where fertilizer runoff is not properly managed. As part of our geographical analysis have performed a desktop survey using data primarily from Indianamap.org, an aerial assessment of the watershed, a windshield survey of many areas of the region, infield assessments of streams and stream surveys. Lands with a high potential for conversion to forest or other conservation type were also identified. Soil types, including highly erodible soils, were mapped and percentages of each were calculated for each subwatershed. Partnerships with Ball State University has enabled more advanced demographic and GIS research.
In addition to looking at existing data, we performed macro scale and subwatershed investigations. We analyzed geomorphology and geology to predict the risk of erosion in subwatersheds. We also looked at contemporary land use and existing ecological regions. We noted the widespread change of the landscape. During our desktop survey, we identified areas with runoff, stream bank erosion, rills/gullies, livestock entering streams, etc. We also noted a lack of stream buffers in many areas. Other land uses, in addition to urban and cropland, that were examined were pastures/grasslands and forests. This information, alongside water quality data, was used to get an idea of the extent that geography influences water quality.
The specific concerns and objectives that project managers have identified through the watershed inventory analysis are briefly summarized below. The overarching goals are to (a) value and preserve the soil and water natural features throughout the watershed region and (b) understand the risks and threats to those natural features. These two goals will assist with in the identification of methodologies to mitigate water quality problems.
1.) Advocate the protection of the region’s valuable farmground.
– Encourage BMP’s like cover crops, conservation tillage, and precision farming.
– Highlight the economic gains possible with BMP implementation.
– Highlight the larger environmental gains of reducing fertilizer, such as reducing hypoxia in the Gulf of Mexico.
– Target high concentrations of farmland to diffuse high concentration of nutrients.
2.) Advocate protection of the region’s aquifers through the protection/enhancement of the region’s forest-wetlands.
– Provide education about the importance of recharging aquifers.
– Provide education about nature’s role in this process and about how environmental changes have altered it.
– Target Lugar and Walnut creeks, where hydric soils and D drainage types are ideal for aquifer recharge.
3.) Advocate protection of the region’s ecological features.
– Work with planning commissions in those Grant County and Upland, where sprawl is occurring
– Ensure preservation of ecological areas along river.
– Protect all remaining non-farmable habitat.
4.) Form a comprehensive E. coli reduction strategy.
– Alert landowners of potential well contamination.
– Promote stream exclusion and manure application BMPs.
5.) Encourage sediment reduction.
– Provide education in Blackford and Grant County about the benefits of conventional tillage.
– Target areas where geomorphology, HES, and high rates of conventional tillage high contribute to sediment loss.
– Promote natural channel design.
– Prioritize streambank stabilization in subwatersheds with areas of high instream erosion.
6.) Promote recreational uses of the river and clear impediments to recreation.
-Continue to pursue grants for logjam removal.
-Provide education through the creation of a recreational guide.

FIG 1 | Rill and gully formations were identified as part of a desktop survey. Rill and gullys are sources of sediment erosion and lead to excess solids in streams and rivers.

FIG 2 | Tributaries in the watershed were analyzed for the presence of vegetated buffers. Buffers are important because they filter out nutrients and sediment in water before it reaches waterways. Purple indicates streams needing buffers, green indicates that adequate buffers are present.
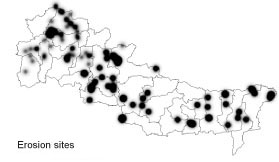
FIG 3 | Heatmap diagram indicates the presence of erosion locations in streams. These are sites where lake edges or large sections of river bank are sloughing off. These sites are a source of the sediment found in waterways.
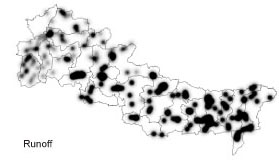
FIG 4 | Heatmap diagram indicates the presence of runoff locations in streams. Runoff sites are areas where rill/gullies or swales have direct access to a water body or where vehicular access sites were identified. Runoff at these sites contributes sediment to waterways.
LOGJAM VIDEO
Project Mangers recorded a survey of logjams as part of the inventory and analysis process. Click the link below to see the video!