
Water Quality Analysis
Like the watershed analysis, water quality data can help locate areas that may have higher levels of “nonpoint source pollution.” Nonpoint source pollution can be hard to identify because it doesn’t come from one place, as pollution from a factory’s pipe does. Together, the watershed analysis and water quality data help give a more complete picture of non-point pollution sources. Analysis of water quality data was used to identify priority areas in the watershed (found in the next section).
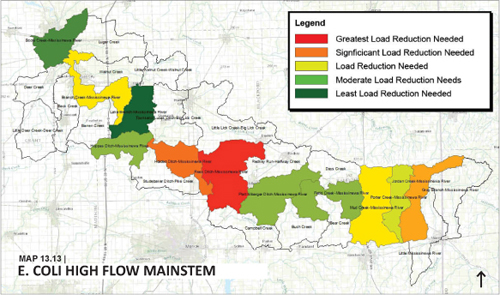
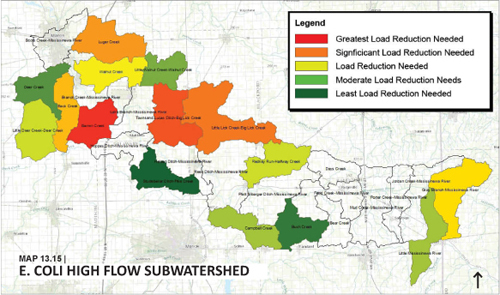

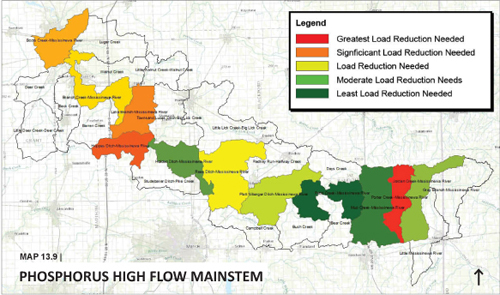
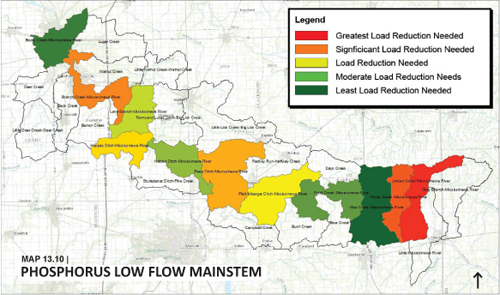
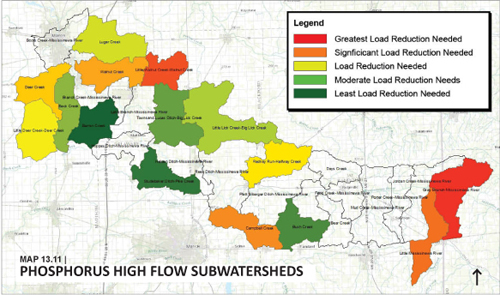
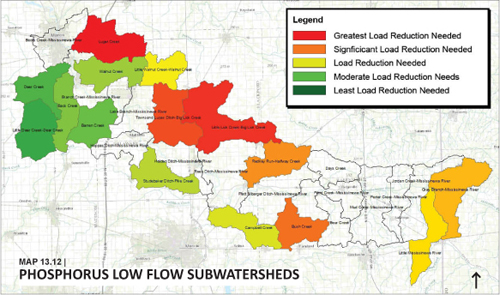
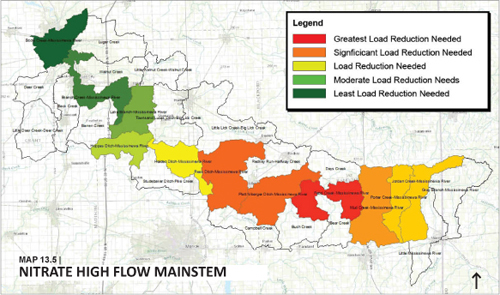
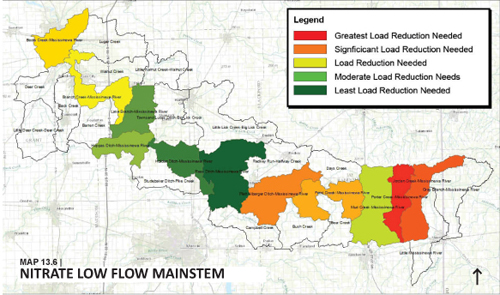
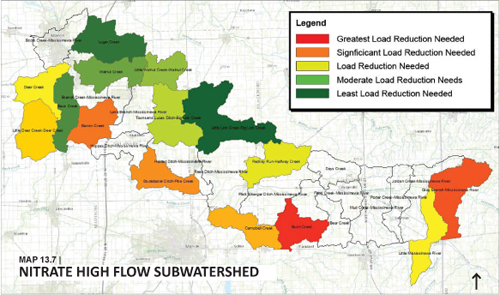
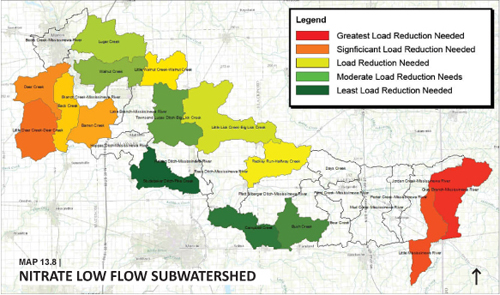
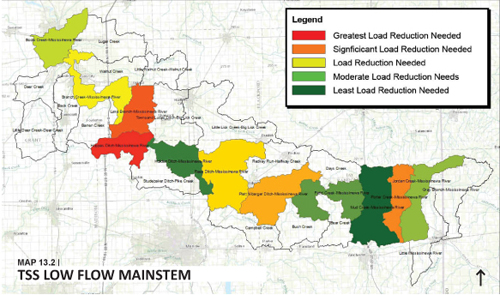
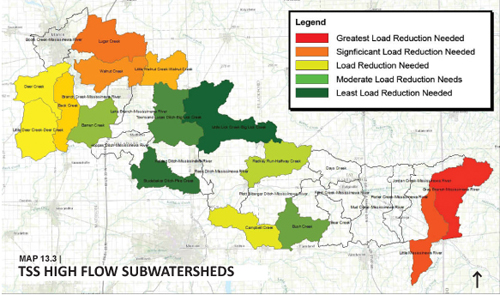
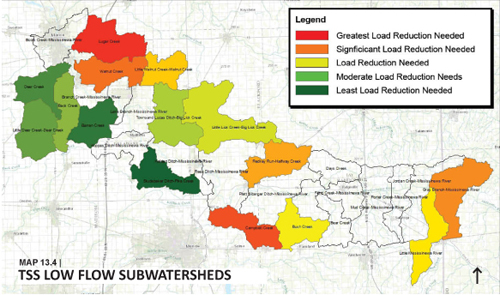
FIG 2 | Water Quality Load Reduction Maps (Use the arrows at the bottom right on the map to see how levels of the different pollutants compared between subwatersheds.)
State Law Requires that Waterbodies Meet “Benefical Uses”
“Beneficial uses” of lakes, river, and streams are mandated by the state and include recreational uses and fish and wildlife uses. Pollutants can impair a river’s ability to provide these mandated beneficial uses to citizens. For example, high E. coli levels indicate contamination of water with human wastes and can make swimming unsafe. High sediment levels can clog fish gills, smother fish eggs, and reduce populations of fish. High nutrient levels can cause fish kills by depleting oxygen dissolved in the water.
Waterbodies are Considered “Impaired” If They Don’t Meet State Standards
A target level for each parameter was selected by the UMRWP from either State water quality standards, EPA water quality recommendations, or recommendations developed by independent scientists. These target levels indicate if “beneficial uses” are being provided. For example, E. coli levels above the target of 235 mg/L shows that there is an increased risk of contracting an illness if recreating in the waterbody. For this project, when these target levels are not met, a water body is considered as not supporting beneficial uses, and is considered “impaired.”
Point and Nonpoint Source Pollutants Cause Impairments
Pollutant sources are classified as point or non-point source pollutants. Point source pollution comes from a pipe that has an easily quantifiable origin (such as a factory or commercial establishment) while non-point sources (such as pollutants found in a sample taken from a river) are more diffuse, have numerous potential origins, and are more difficult to track.
UMRWP Water Quality Monitoring Objectives
There are three main non-point source pollutants that the UMRWP seeks address through the development of the watershed management plan: sediment, E. coli, and nutrients (nitrate and phosphorus). Objectives of water quality monitoring are as follows:
• Select “critical”, or “priority areas”
The key objective of the watershed management planning process is to determine areas of the watershed that are the most impaired by sediment, nutirents, or E. coli. These geographical areas are called “critical areas” or “priority areas” and they are the project’s formal recommendation to the EPA and the State of Indiana for targeted investment of cost-share dollars and educational resources. The watershed project uses a combination of land-use data, water quality information, and public concerns to develop these watershed critical areas.
• Calculate pollutant loads to use for quantifying the impact of implemented BMPs
We compared current loads to target loads and noted how much the current load exceeded the target load (a load is an estimation of the amount of a pollutant that a waterbody carries over a certain period of time and is calculated using both the average pollutant concentration and average flow rate). This helps us understand how many times the current load exceeds the target load and what type of reduction is required to meet the target. Being able to estimate how much pollution is reduced by newly initiated BMPs gives us an idea of how we are impacting the “bigger picture” (i.e., the Gulf of Mexico Dead Zone, etc).
• Collect flow data to understand how the weather drives pollutant levels.
Because we measured the flow of the water when we collected water quality samples, we were able to categorize the flow as “high” or “low.” Flow is important because it can give us clues as to recent weather events. High flow events (i.e. water level in the stream is high and water is flowing more quickly) occur following heavy rainfall. Because heavy rainfall can cause soil erosion, nutrient leaching, etc., higher levels of pollutants are expected during high flow events. Similarly, lower levels of pollutants are expected during low flow events.
E. COLI
The most significant source of E. coli to streams and rivers are Waste Water Treatment Facilities. Many sanitary sewer systems are combined with storm water systems; during heavy rainfall, these combined systems overflow, discharging raw sewage into rivers. E. coli levels in waterways immediately downstream of an overflow discharge can be as high as 300 times the state standard! There are eight major Waste Water Treatment Facilities in the watershed.
Another major source of waste to waterways are failing septic tanks. While one isolated septic tank is a relatively low risk, large concentration areas of failing septic tanks can have collective contribution on par with small sewage treatment overflows. Many septic tanks built prior to 1980 were inadequately constructed for the soil types in this region. The highest concentrations of homes on septic tanks are just outside of Waste Water Districts and in proximity to major cities/towns in the region including Albany, Desoto, Eaton, and Dunkirk as well as areas adjacent to the cities of Marion, Upland, and Albany. The expansion of these unincorporated areas are a concern to stakeholders. Although there is an overall population decrease in the watershed, some census tracts adjacent to these concentration areas are growing (the definition of sprawl is new construction at a rate faster than population increases).
A third major source of E. coli is waste from Combined Feeding Operations (CFOs). The eastern portion of the watershed (Darke and Randolph counties) has the highest concentration of CFOs in the region. In fact, Darke County has the highest concentration of CFOs in all of Ohio. Unfortunately, accidental overflow or inappropriate field application of animal waste can lead to an increase of E. coli in streams. UMRWP preliminary water quality testing and historic water quality data both show high levels of E. coli throughout the watershed. This is the shared responsibility of Waste Water Treatment Facilities, high septic concentration areas, and CFOs.
SEDIMENT
Despite the region’s relatively “flat” terrain, there are discernible geographical differences throughout the watershed region. Many of the differences are driven by slight changes in topographic undulation, the formation of surface drainage patterns over a given area, and the frequency that these flow lines form larger channels. Subwatersheds that have a higher frequency of drainage channels have a greater sediment transport potential (and a higher probability of rill and gully formation). Watershed planners performed a desktop survey of rill and gully formations in farm fields and found a higher concentration of these formations in subwatersheds originally projected to have higher transport potential; this was further corroborated by preliminary water quality data. Furthermore, many of these same subwatersheds (located in Grant and Blackford Counties) are also regions where there is an elevated presence of highly erodible soils (further supporting the need for Sediment Best Management Practices to counter-act geomorphological challenges). This is an example how water quality sampling, modeling, and desktop surveys can be used together to identify sediment transport priority areas.
NUTRIENTS
Nutrient levels are typically elevated in areas that have a higher concentration of acreage in agricultural production. This is because chemical fertilizer application rates are higher on agricultural fields in terms of tons/acres/year (the second highest source is urban areas). Therefore, when using simple nutrient prediction modeling, it follows that subwatersheds with the highest percentage of agricultural lands should have the highest estimated discharge of nutrients to streams; preliminary UMRWP water quality data confirms this predicted correlation. The preliminary water quality data suggests subwatersheds with the highest percentage of agricultural lands have the highest loading of nitrogen in streams. The good news is that corn stalk nitrogen data collected by farmers participating in the On-Farm Network® demonstrates that 80-85% of producers are applying optimal levels of nitrogen in the region. Optimal levels are application rates that leave little nitrogen in the plant or in the ground following corn production (nitrogen that does not benefit production is considered excessive). It is likely that farmers in subwatersheds identified as having elevated levels of nitrogen are not managing their farm (application rates) any differently than the rest of their peers in the region; it is simply that these farmers are in subwatersheds with a higher percentage of land-use suitable for agriculture. The increase of Best Management Practices in these Subwatersheds may help diffuse nutrient concentration in these specific streams.
Water Quality Data from Previous Studies
The UMRWP utilized existing data (building upon existing LARE diagnostic conclusions) to construct a monitoring program. The following problems were identified through these previously completed studies and through public input:
-Headwaters Mississinewa River (HUC_1 0 0512010301) is on the 2008/12 303(d) list for impaired biotic communities, FCA (PCBs and mercury) and for E coli. State averages for DO are as high as 274% of saturation. Less than 1 % of the land is urbanized although the Little Mississinewa River subwatershed has significant contamination from industrial sources and contains a Superfund site. 30 miles of stream(s) in the Ohio portion of the WMP area are on the 303d list for Pathogens and Habitat Alterations. Phosphorus loading per acre/year is highest in the Mitchell Ditch subwatershed, perceptually from non-point agricultural sources. (Source: Upper Mississinewa River Watershed Diagnostic Study (Phase 1), Harza 2001)
-Halfway Creek-Mississinewa River (HUC_1 0 0512010302) is on the 2008/12 303(d) list for impaired biotic communities, FCA (PCBs and mercury) and for E coli. Suspended solids concentrations are higher than most other Indiana agricultural streams (avg: 30mg/L) and the E.coli bacteria levels frequently exceed the Indiana water quality standard for recreational uses (avg: 4070 CFU /100ml). Nutrient values at monitoring sites are elevated compared to many other Indiana streams in agricultural areas (P: 0.72mgll). The Town of Ridgeville has three combined sewer overflows discharging untreated sanitary and storm water during high flow periods. The Town of Albany’s wastewater system has peak flows which often exceed design flows causing untreated sewage to frequently overflow to Halfway Creek. Nutrients in Halfway Creek-Mississinewa River were elevated compared to many other Indiana streams in agricultural areas. (Source: Mississinewa River (Phase 2) Watershed Diagnostic Study, Commonwealth Biomonitoring 2005)
-Pike Creek-Mississinewa River (HUC_1 0 0512010304) is on the 2008/12 303(d) list for PCBs, mercury, and E coli. Water quality within the watershed is characterized by high concentrations of nutrients (phosphorus and nitrogen) and high counts of E. coli bacteria. Biological integrity ranged from severely impaired to slightly impaired, based on IBI/QHEI measurements; and moderately impaired to slightly impaired based upon mlBI measurements. Rees Ditch is among the highest for total nitrogen, perceptually from agricultural sources. (Source: Watershed Diagnostic Study of the Upper Mississinewa R. Watershed {Phase III), Cedar Eden 2009)
-Big Lick Creek (HUC_10 0512010303) is on the 2008/12 303(d) list forE coli. The watershed is predominantly agricultural with the exception of Hartford City (which has percieved septic and waste management problems).
-Massey Creek-Mississinewa River (HUC_1 0 0512010305) is on the 2008/12 303(d) list for impaired biotic communities, FCA (PCBs and mercury) and for E coli. Monitoring indicated exceedendes of Water Quality Standards for most impairments and was identified in the highest category for potential sediment loading due to higher slope and proximity to the Mississinewa River (Taylor University, 2005). While the subwatersheds originate in agricultural land, all flow through urban areas near their confluences with the Mississinewa River. Based on predictive modeling, Deer Creek has highest nutrient loading due to higher percentage of agricultural land use. (Source: Middle Mississinewa River Watershed Diagnostic Study Taylor, 2012)
Water Quality Monitoring Conducted for the WMP
The water quality monitoring program conducted from 2014-2015 supplements existing studies and was used determine geographic regions in the drainage area for enhanced planning. Monitoring established a baseline at all HUC10 pour points. Starting in April 2014, the project analyzed water quality at over 40 sites in partnership with the IDEM Total Maximum Daily Load Program. Stream samples collected by the Delaware County Soil and Water Conservation District (DCSWCD) were analyzed by the Muncie Bureau of Water Quality.
Data from the first six months of the project, corresponding to the planting through harvest season, were analyzed and compared to water quality standards and guidelines. This data was then compared with the non-growing season to observe seasonal changes in the nutrient and sediment levels. In addition, biologists at the Muncie Bureau of Water Quality completed fish and macroinvertabrate inventories at fifteen sites in the watershed; these sites were analyzed based on State and Federal protocols. Fish are seen as indicators of water quality because of their long-term presence in streams. Average fish scores for the sampling sites were good or fair which is consistent with historical studies over the past thirty years. While there is still room for improvement, it is encouraging that water quality in the region is stable and not degrading. There was not enough data to determine if water quality has improved since four LARE studies were completed in the early 2000s. The project manager also collected gauge data (representative of Mississinewa River sample sites), completed cross sectional surveys of tributaries in the UMRW, and completed a comparative analysis of basin characteristics using StreamStats and bankful regression curves (width, depth, and area) published by the USGS. Water depth and surface flow measurements were collected during each sample period. The comparison of flow/depth allows for the project manager to compare samples based on water discharge. Each site was organized based on bankful flow, high flow, and low flow events and compared for trends.
Statewide Significance
Water quality pollutants are impairments to state mandated designated uses. Pollutants analyzed by IDEM as part of the water quality assessment include, but are not limited to: bacteria, cyanide, mercury, nutrients, sediments, and PCBs. Pollutant sources are classified as point or non-point source pollutants. Point source pollution comes from a pipe that has an easily quantifiable origin (such as a factory or commercial establishment) while non-point sources (such as pollutants found in a sample taken from a river) are more diffuse, have numerous potential origins, and are more difficult to track. There are three main non-point source pollutants that the project seeks to identify and address through the development of the watershed management plan: sediment, E. coli, and nutrients.
IDEM Collaboration
During Quarter 5 of the project, the Indiana Department of Environmental Managed completed a water quality monitoring program for thirteen subwatersheds located in the central Upper Mississinewa River Watershed basin. The program consisted of monthly water chemistry studies, as well as an assessment of fish and macroinvertabrates. While IDEM was collecting this data primarily for the development of Total Maximum Daily Loads in this region (see loading estimates below), data collected by IDEM was shared with UMRWP Project Mangers and was used to assess water quality and identify possible sources of nonpoint source pollution. The project manager participated in a stakeholder data review session at the IDEM offices in Indianapolis where data was assessed by a working group and potential sources were identified. This review session was helpful for enhancing our understanding of the central watershed region and some of the concerns and problems identified by IDEM field staff engaged in the year long monthly analysis process. The UMRWP was able to incorporate data collected by IDEM in establishing a TMDL for portions of the Mississinewa Basin into the watershed management plan. IDEM data was used to identify priority areas.
Loading Estimates
While sediment transport is a natural function of rivers (even necessary for a healthy aquatic ecosystems), excess sediment in our water bodies is one of the major water quality concerns for this project. Excess sediment can negatively effect habitat, impact recreational opportunities, and influence stream aggradation/degradation (resulting in bank erosion and loss of adjacent land). Water quality experts expect healthy rivers to transport sediment and the IDEM target for sediment in waterways is 25 milligrams per liter of stream water. However, on average, sediment in the Mississinewa River is 53 mg/L. That’s two times the target!
Each time we collect a sample we also collect information that allows us to estimate how much water is flowing in the channel per second at the time of sampling. This allows us to estimate how much total sediment (“the load” measured in tons) is flowing through the river at that time of the sample. We know each sample event will have different loads based on the volume of water present during the time of sampling. By using loading estimates, we are able to compare streams of various scales and sampling volume to each other more effectively through comparing the relationship (ratio) between the individual target load versus the stream’s measured load. We calculated loading estimates for each sample for all measured parameters (E. coli, sediment, phosphorus, and nitrogen).
Sampling Sites
The following sites were monitored by the DCSWCD.
1 40.576325, -85.659558 Mississinewa River
2 40.538882, -85.627643 Lugar Creek
3 40.523972, -85.624233 Mississinewa River
4 40.508376, -85.637466 Deer Creek
5 40.458712, -85.700964 Deer Creek
6 40.489164, -85.628868 Back Creek
7 40.502077, -85.615392 Walnut Creek
8 40.491645, -85.483593 Walnut Creek
9 40.452144, -85.526530 Mississinewa River
10 40.452118, -85.545115 Barren Creek
11 40.422630, -85.508438 Mississinewa River
1 40.285132, -84.919396 Mississinewa River
2 40.289395, -84.881421 Mississinewa River
3 40.287907, -84.832111 Little Mississinewa River
4 40.293458, -84.824397 Mississinewa River
Stream Gauge Information
Two USGS stream gauges are located on the Mississinewa River, one in Ridgeville and one in Marion. Data from the gauges can be viewed at the following sites:
http://water.weather.gov/ahps2/hydrograph.php?gage=rgvi3&wfo=ind
http://waterdata.usgs.gov/nwis/uv?site_no=03325500.
Additional Studies
In addition to water quality monitoring, the following GIS desktop surveys and models were also used to identify water quality problems within the watershed.
STEPL Model
Region 5 Model
Simple Coefficient Method for estimating nutrient loading
Stream Vegetation/Buffer Analysis
Delineate Headwater Drainage Basins in 303d Listed Streams
Non-farmable Lands Prioritization Ranking Process
Land Use Sediment Runoff Estimates
Historic Water Quality
TABLE 1 | Historic Mississinewa River Water Quality
| Data Source | E. coli (cfu/100ml) | Nitrate (mg/L) | P (mg/L) | TSS (mg/L) |
|---|---|---|---|---|
| STORET | 2188 | 1.2 | 0.18 | 36 |
| IDEM | 3101 | 3.4 | 0.18 | 43 |
| LARE | 1957 | 4.0 | 0.19 | |
| MISS 205J – Average | 907 | 3.9 | 0.29 | 57 |
| MISS 205J – High | 1905 | 7.21 | 0.52 | 151 |
| MISS 205J – Low | 485 | 2.45 | 0.19 | 15 |
ADDITIONAL STUDIES TO BE FOUND IN THE WATERSHED MANAGEMENT PLAN
– A comparison of other recreational streams in the state of Indiana
– Water quality data collected by both the UMRWP and IDEM
– An in-depth discussion of the five HUC 10 subwatersheds within the Upper Mississinewa River Watershed
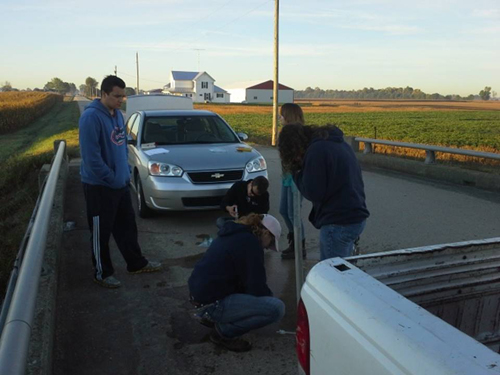
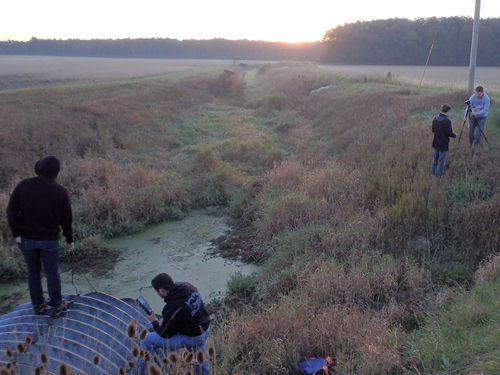
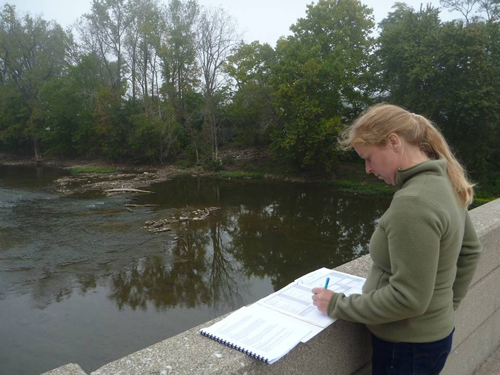
FIG 1 | Many groups contributed to the water quality monitoring effort for this WMP. These groups included the UMRWP, the Muncie Bureau of Water Quality, Ball State University, and the Indiana Department of Environmental Management.
Data Sources
Data from numerous sources was analyzed; a report is included within the Watershed Management Plan. The buttons below contain links to these data sources.
STORET
EPA Storage and Retrieval is a federal database containing water quality data from the past 45+ years.
IDEM Aims
IDEM AIMS is a database that contains water quality data from the past 20+ years. It contains data on both surface and groundwater.
Hoosier Riverwatch
Hoosier Riverwatch is an IDEM program that trains volunteers to monitor the water quality of streams. A online database is available to volunteers for data input.
LARE
The Indiana Department of Natural Resource’s Lake and River Enhancement program (LARE) has funded numerous watershed diagnostic studies. The collection of water quality data is required.
TMDL
The US EPA requires that a Total Maximum Daily Load Report (TMDL) be developed for water bodies that are impaired. TMDL reports include an overview of the watershed and an analysis of possible sources of pollutants within the watershed.
Muncie Bureau of Water Quality
The Muncie Bureau of Water Quality has been collecting water quality data throughout Muncie and surrounding areas since its inception in 1972.